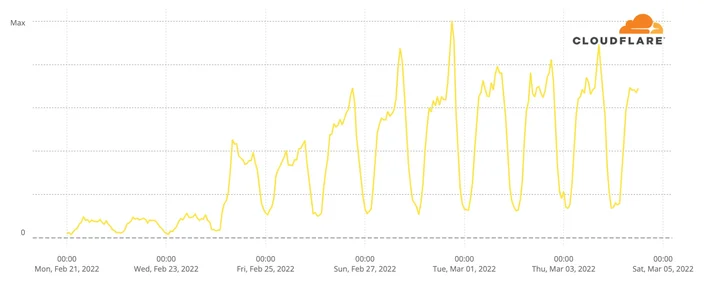
Internet traffic patterns in Ukraine since February 21, 2022


Cloudflare operates in more than 250 cities worldwide where we connect our equipment to the Internet to provide our broad range of services. We have data centers in Ukraine, Belarus and Russia and across the world. To operate our service we monitor traffic trends, performance and errors seen at each data center, aggregate data about DNS, and congestion and packet loss on Internet links.
Internet Traffic
For reference, here is a map of Ukraine showing its major cities. Note that whenever we talk about dates and times in this post, we are using UTC. Ukraine’s current time zone is UTC+2.
%22%2F%3E%3C%2Fsvg%3E)
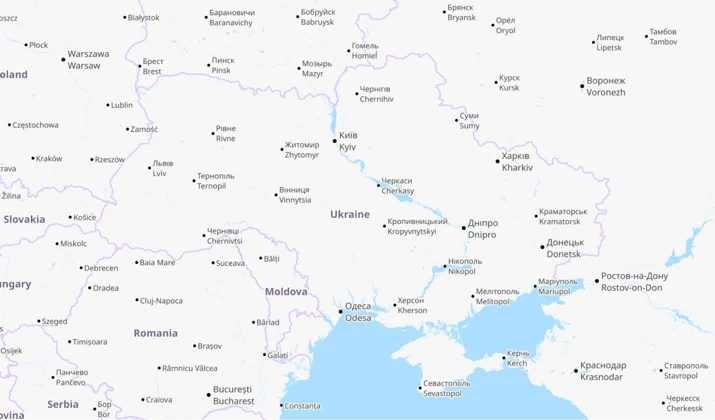
© OpenStreetMap contributors
Internet traffic in Ukraine generally follows a pretty predictable pattern based on day and night. Lowest in the hours after local midnight and picking up as people wake up. It’s not uncommon to see a dip around lunchtime and a peak when people go home in the evening. That pattern is clearly visible in this chart of overall Internet traffic seen by Cloudflare for Ukrainian networks on Monday, Tuesday, and Wednesday prior to the invasion.
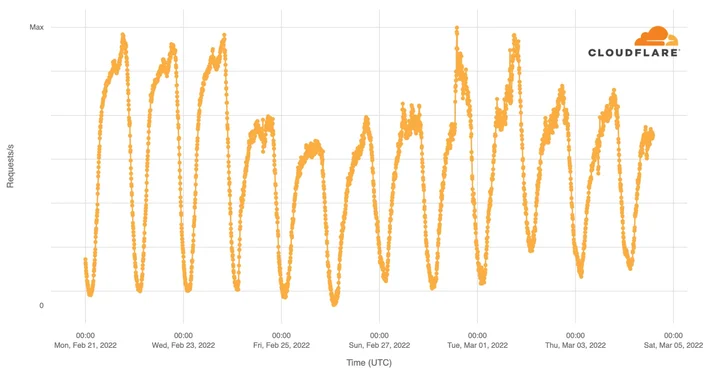
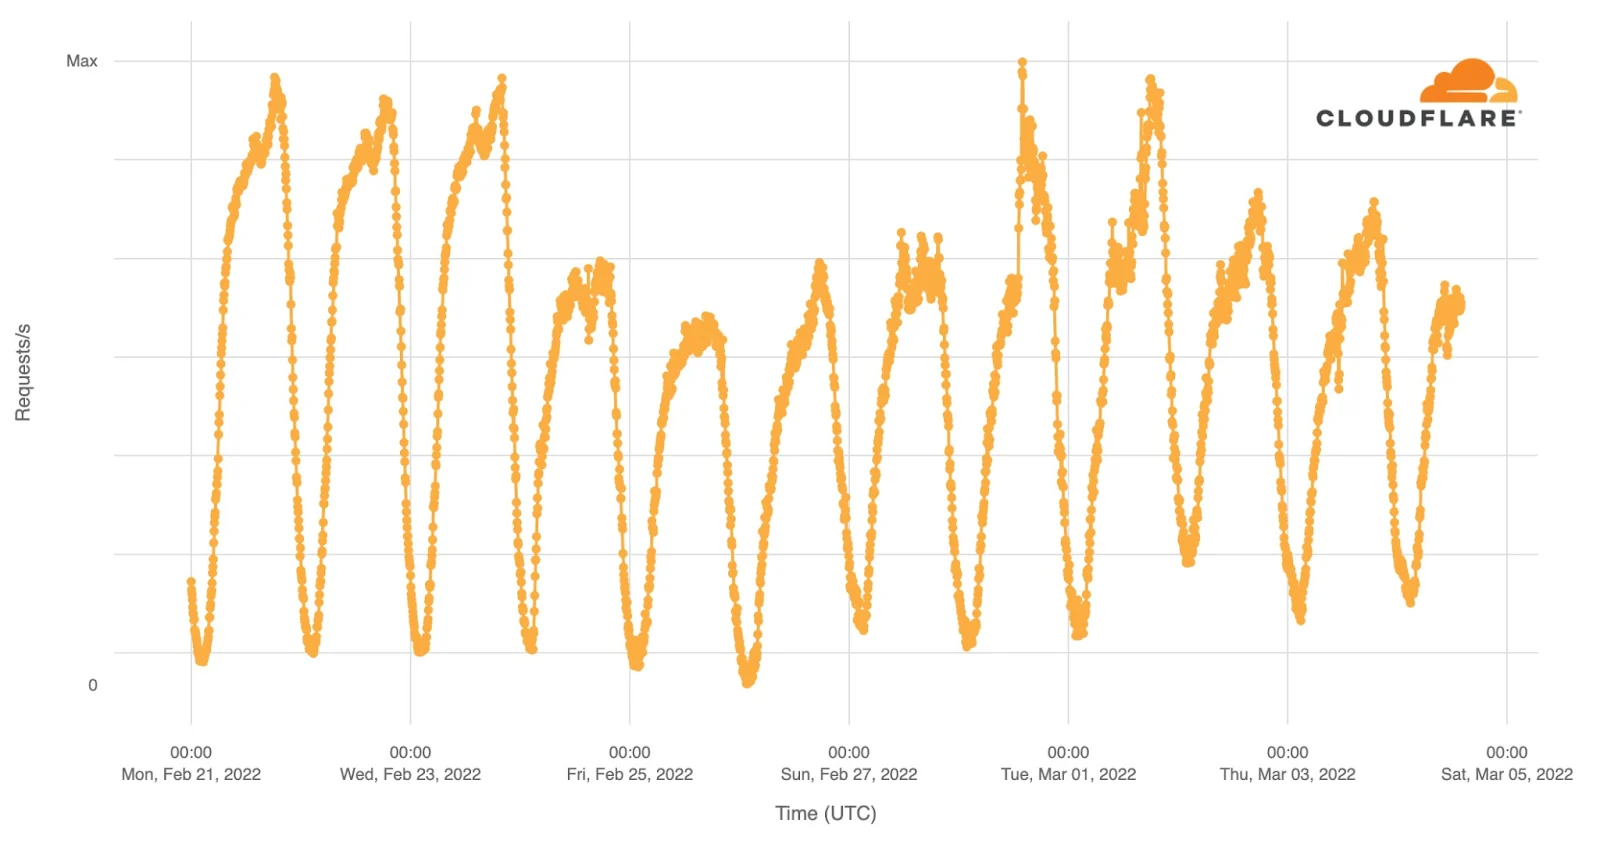
Starting Thursday, traffic was significantly lower. On Thursday, we saw about 70% of our normal request volume and about 60% on Friday. Request volumes recovered to 70% of pre-invasion volume on Saturday and Sunday before peaking on Monday and Tuesday because of attacks that we mitigated coming from networks in Ukraine.
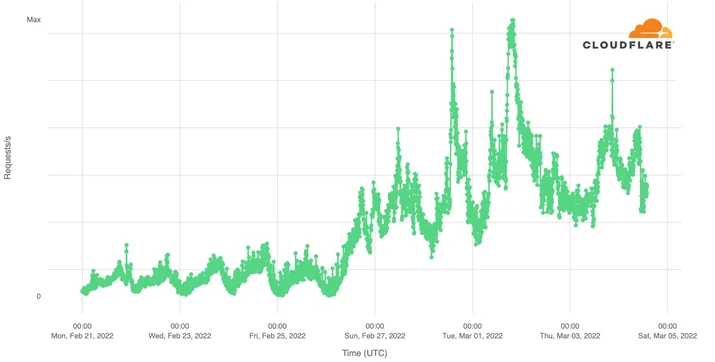
This chart shows attack traffic blocked by Cloudflare that originated on networks in Ukraine. Note that this is quite different from attacks against .ua domains, which can originate anywhere in the world and are discussed below.
Analysis of network traffic from different cities in Ukraine gives us some insight into people’s use of the Internet and availability of Internet access. Here’s Internet traffic from the capital, Kyiv:
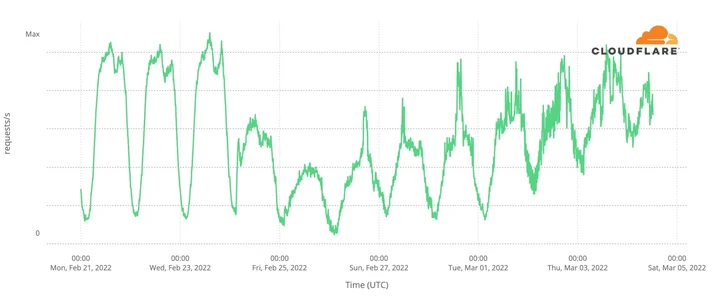
Once again the “normal” ebb and flow of Internet traffic is seen on Monday, Tuesday, and Wednesday. Early on Thursday morning, Internet traffic picks up after Vladimir Putin’s announcement of the attack but never reaches normal levels that day. Friday is even lower, but traffic in Kyiv has gradually increased since then.
Moving westward to Lviv, we see a very different pattern of use.
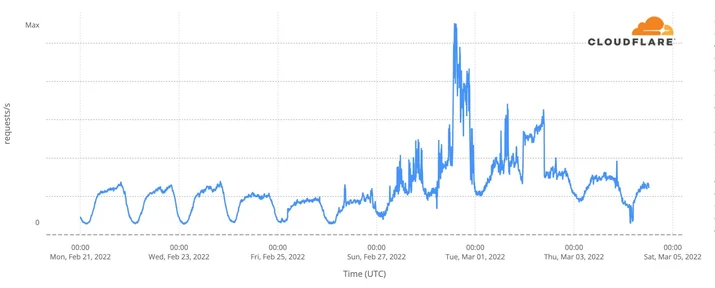
The same normal flows on Monday to Wednesday are visible, followed by a smaller drop for three days and then a dramatic increase in traffic. As many Ukrainians have moved westward towards Poland, Slovakia and Romania, away from the fighting, it appears that Internet traffic has grown with their arrival in Lviv.
The city of Uzhhorod on the Slovakian border shows a similar pattern.
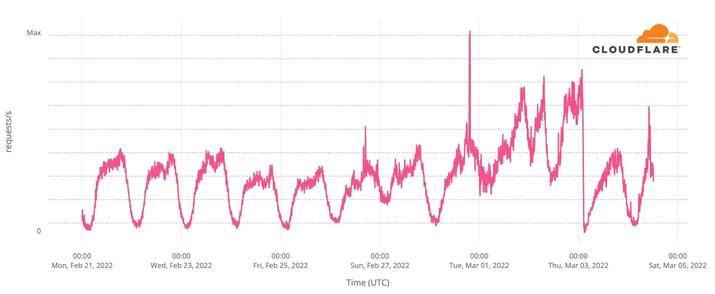
To the east of Lviv, the city of Ternopil has also seen an increase in Internet traffic.
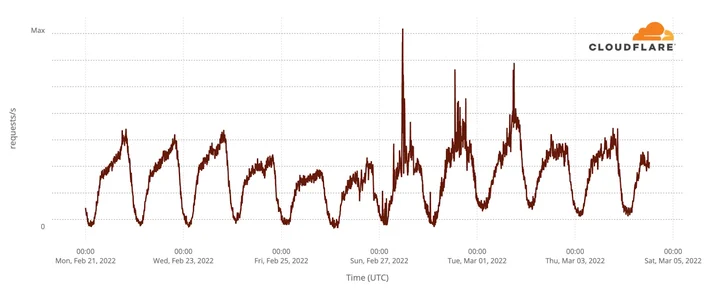
As has Rivne.
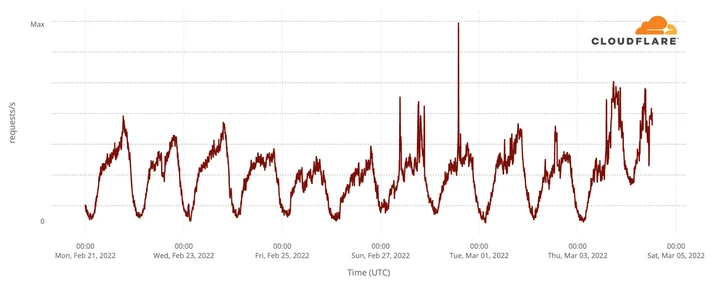
Looking at Rivne, Ternopil, Uzhhorod, and Lviv, it’s possible that the peaks in Internet traffic on different days show the movement of people westward as they try to escape fighting around the capital and in the east and south.
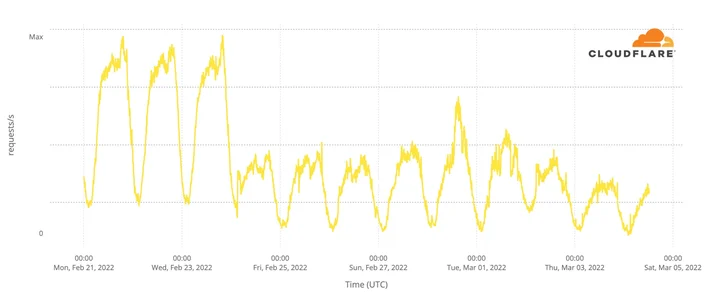
On the opposite side of Ukraine, the situation is quite different. Here’s the traffic pattern for the city of Kharkiv. It has stayed at roughly between 50% and 60% (March 3) of the usual rate since the beginning of the invasion.
North of Kharkiv, the city of Sumy (north-eastern Ukraine, near the Russian border), traffic levels are very low since yesterday, March 3, 2022.
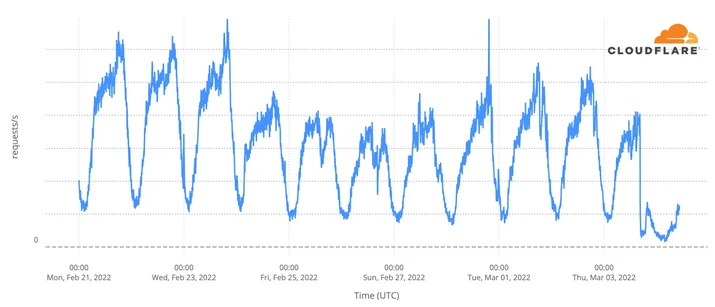
A similar trend can be seen in the city Izyum, south of Kharkiv (east of Ukraine), where traffic is very low since March 2.
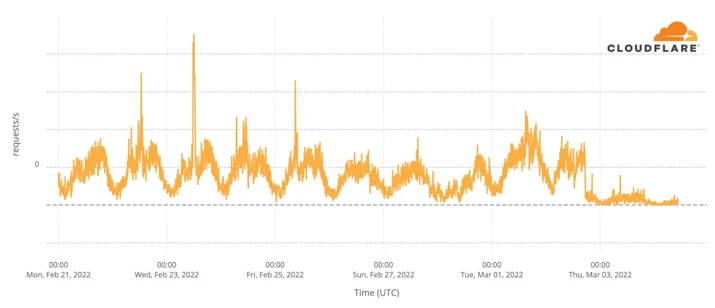
Traffic in Donetsk has remained fairly consistent throughout the invasion, except for March 1 when there was a dramatic change in traffic. This was most likely caused by an attack against a single .ua domain name, with the attack traffic coming, at least in part, from Donetsk.
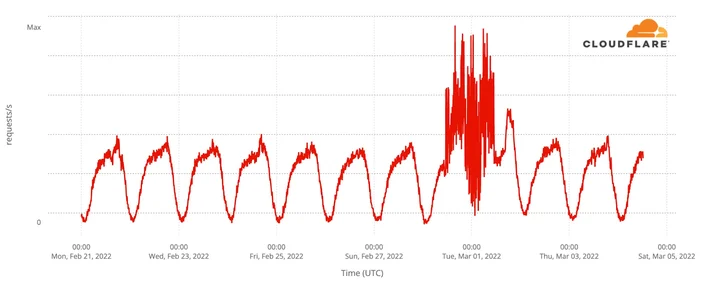
Some other areas with fighting have experienced the largest drops and partial Internet outages. Moving to the south, traffic in Mariupol declined after the invasion and has dropped dramatically in the last three days with outages on local networks.
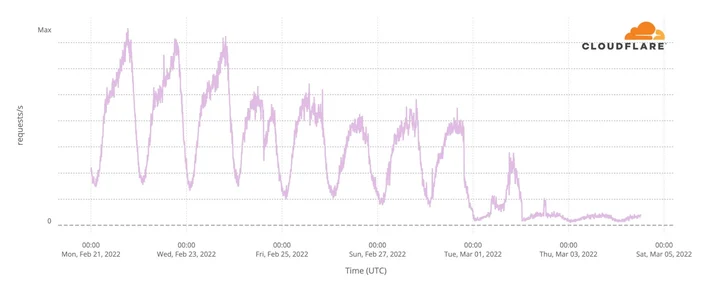
Here’s a view of traffic from AS43554 in Mariupol showing what seems to be a total outage on March 1 that continued through March 4.

To the west of Mariupol, Osypenko shows a gradual decline in traffic followed by three days of minimal Internet use.
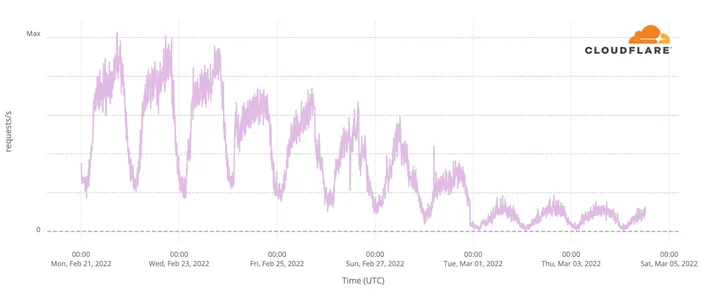
Similar large drops are seen in Irpin (just outside Kyiv to the northwest).
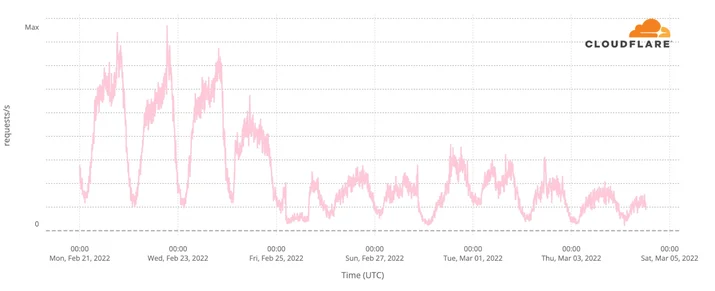
And in Bucha, which is next to Irpin; both Bucha and Irpin are close to Hostomel airport.
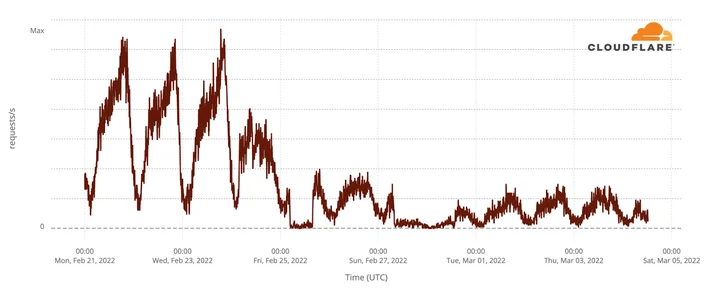
Enerhodar is the small city in the south of Ukraine where Europe’s largest nuclear plant, Zaporizhzhya NPP, is located.
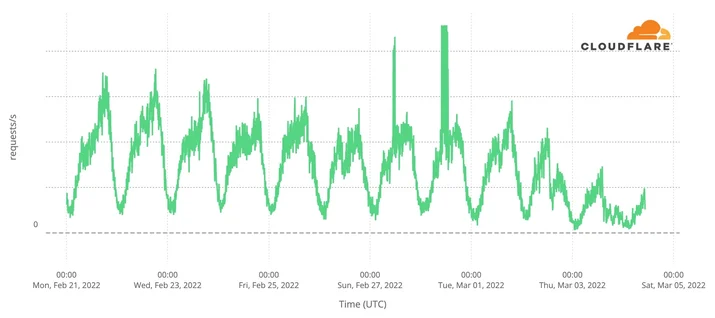
There has also been minimal traffic (or possible outage) from Severodonetsk (north of Luhansk) for the past four of days.
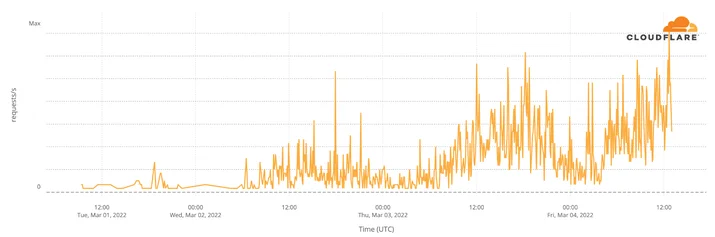
We have started to see traffic from Starlink terminals in Ukraine, although traffic levels remain very low.
Cyberattacks
The physical world invasion has been accompanied by an increase in cyberattacks against Ukrainian domain names and networks.
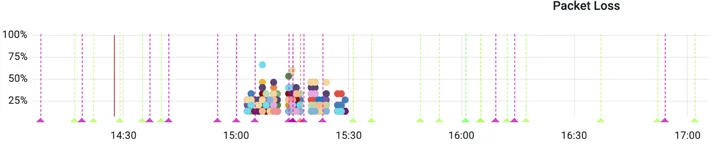
Just prior to the invasion, on February 23, Cloudflare’s automated systems detected a large amount of packet loss on a major Internet connection to our Kyiv data center and automatically mitigated the problem by routing traffic onto other networks. This packet loss was caused by congestion on the transit provider’s network, which in turn was caused by a large DDoS attack. It appeared in our dashboards as packet loss over a 30-minute period between 1500-1530 (the different colors are different parts of our network infrastructure in Kyiv).
This next chart gives an overview of traffic to .ua domains protected by Cloudflare and requests that are “mitigated” (i.e. blocked by our firewall products). The chart shows only layer 7 traffic and does not give information about layer 3/4 DDoS, which is covered separately below.
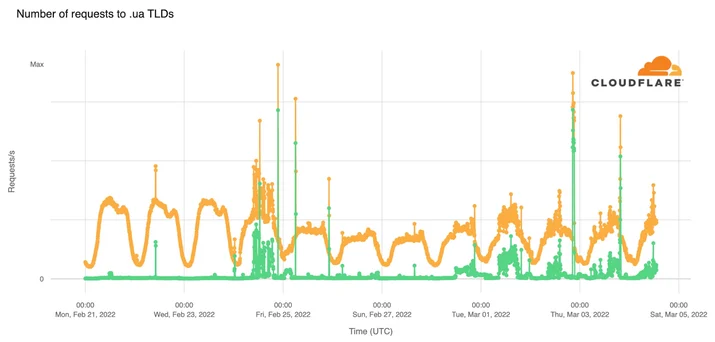
On the first day of the invasion attacks against .ua domains were prevalent and at times responsible for almost 50% of the requests being sent to those domains. From Friday, February 25 attacks returned to levels seen prior to the invasion and started picking up again on Tuesday, March 1.
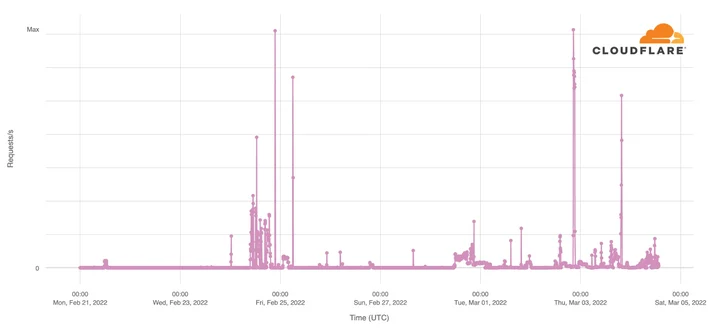
Digging into the layer 7 mitigations we can see that the biggest attacks over all are layer 7 DDoS attacks.
The next largest attacks are being mitigated by firewall rules put in place by customers.
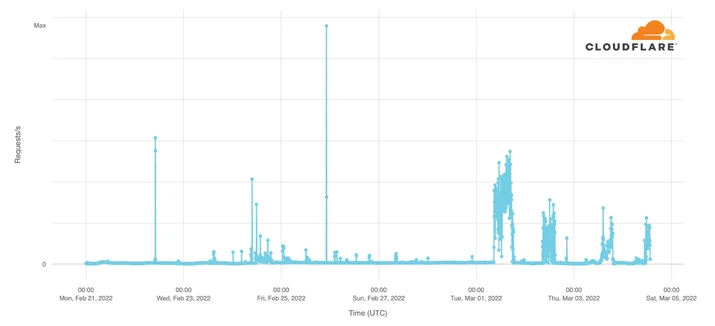
Followed by blocking requests based on our IP threat reputation database.
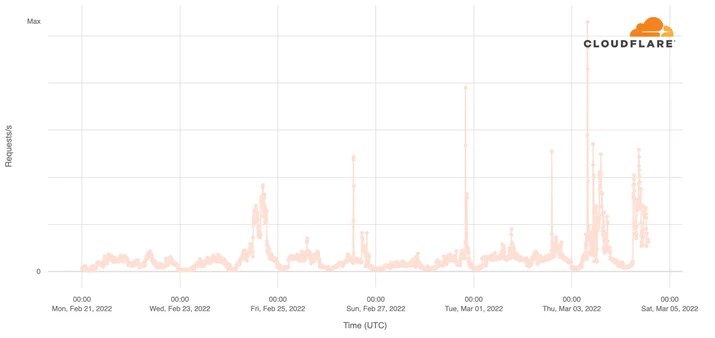
Layer 3/4 traffic is harder to attribute to a specific domain or target as IP addresses are shared across different customers. Looking at network-level DDoS traffic hitting our Kyiv data center, we see occasional peaks of DDoS traffic reaching a high of nearly 1.8 Gbps.
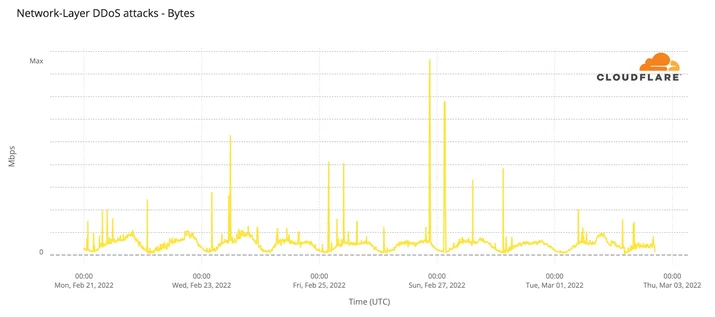
Note that although the layer 3/4 and layer 7 attacks we are mitigating have been relatively small, that does not mean they are not devastating or problematic. A small website or service can be taken down by relatively small attacks, and the layer 7 attack traffic often includes vulnerability scanning, credential stuffing, SQL injection, and the usual panoply of techniques carried out to either deface or penetrate an Internet service.
Unprotected Internet properties are vulnerable to even small attacks and need protection.
Social media and communications
Much of the imagery and information coming out of Ukraine is being shared on social networks. Looking at social networks in Ukraine via DNS data shows that Facebook use has increased.
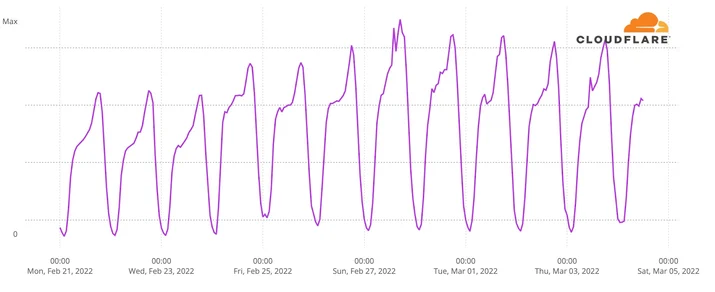
As has Instagram.
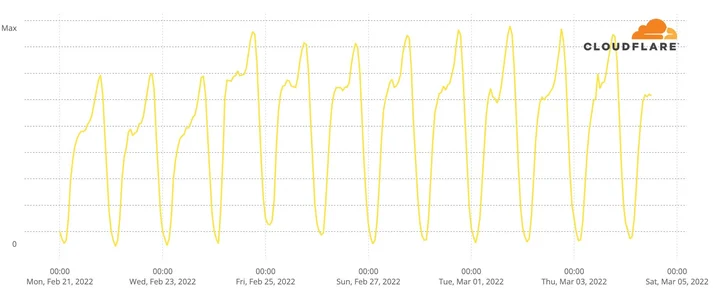
However, TikTok seems to have lost traffic initially, but it has started to return (although not to its pre-conflict levels) in the last two days.
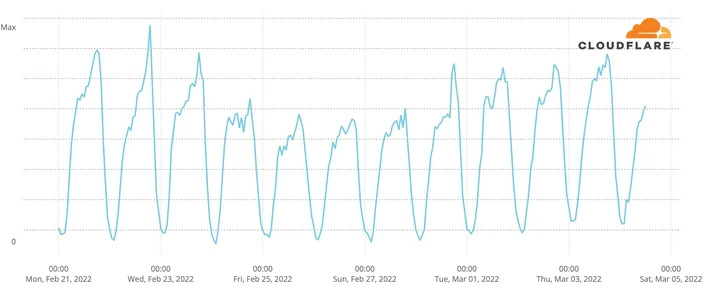
Twitter usage increased and has remained higher than levels seen before the invasion.
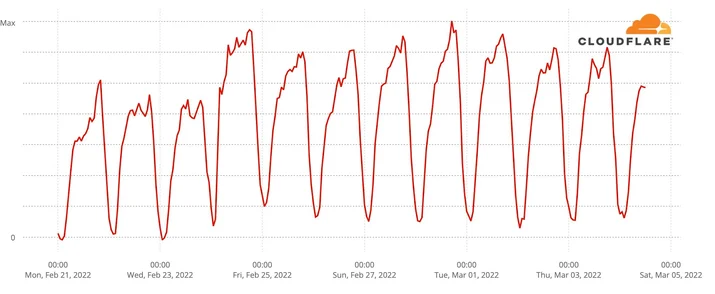
Turning to messaging apps, we can compare Messenger, Signal, Telegram and WhatsApp. WhatsApp traffic appears to have declined inline with the broad change in Internet traffic across Ukraine.
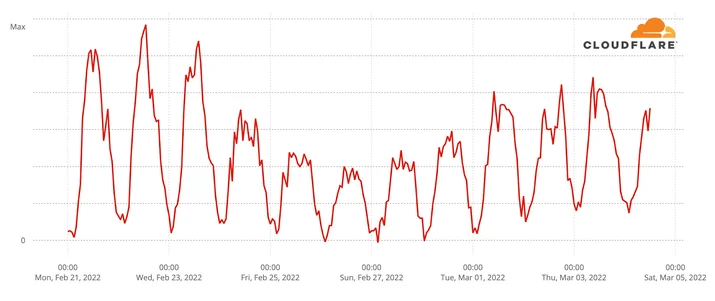
Telegram stayed largely unchanged until early this week, when we observed a small increase in use.
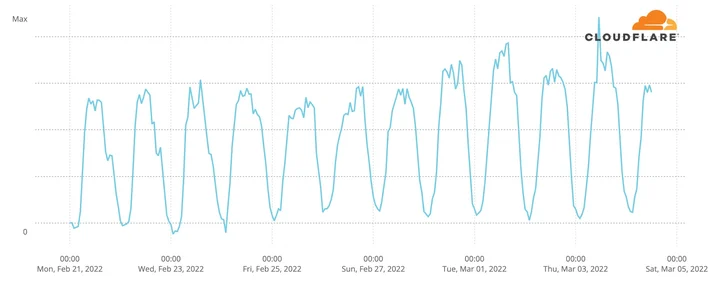
Messenger shows a similar pattern.
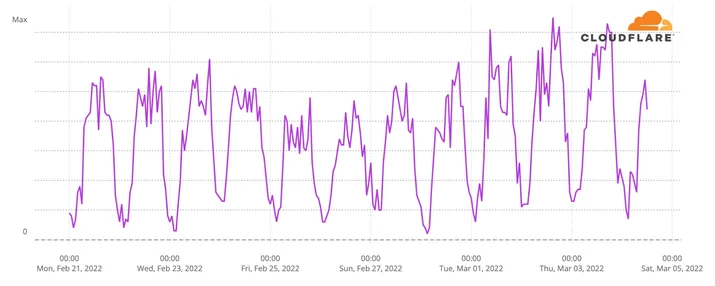
But the largest change has been traffic to the end-to-end encrypted messaging app Signal, which has seen dramatic growth since the invasion began. We are seeing 8x to 10x the DNS volume for Signal as compared to the days before the start of the conflict.